

How to Choose the Best Cobot Robot for Your Business?
Choosing the best cobot robot is not simply a matter of comparing prices. It is a production decision involving people, processes, safety, and future growth. The International Federation of Robotics reported 541,302 industrial robots installed worldwide in 2023. Collaborative robots remain a smaller segment, but their flexible deployment attracts small and medium-sized manufacturers. A cobot robot may load a machine, pick components, or support repetitive assembly beside trained workers.
The right choice begins with the task. Measure payload, reach, cycle time, repeatability, gripper weight, and available floor space. Then examine programming, vision compatibility, safety functions, service access, and total ownership cost. A polished demonstration can hide difficult integration. Test the robot using your actual parts, fixtures, lighting, and operator workflow. Small details matter, such as a two-millimeter alignment error or a cable placed across a walkway.
Esben Østergaard, Universal Robots’ co-founder and a leading collaborative robotics expert, has said, “The goal of cobots is not to replace people, but to help them.” That principle should guide the purchase. The best system reduces strain while preserving meaningful human control. Interact Analysis has also identified continued growth in collaborative robot adoption, driven by labor shortages and production flexibility. Yet forecasts are not guarantees. Your factory may need a slower, safer deployment than a competitor. No spreadsheet predicts every shift change, maintenance delay, or hesitant operator. A sound evaluation combines report data with hands-on trials, documented risk assessment, and feedback from the people who will use the cobot robot every day.
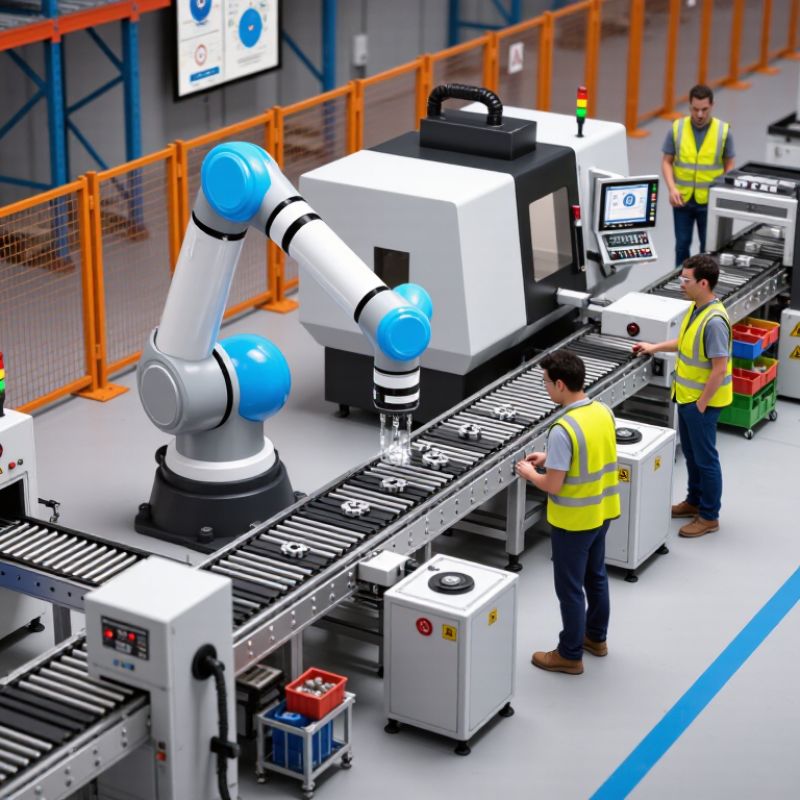
Assess Workcell Demand with IFR’s 162 Robots per 10,000-Workers Benchmark
How to Choose the Best Cobot Robot for Your Business?
The International Federation of Robotics reports 162 industrial robots per 10,000 manufacturing workers. Use this figure as context, not a purchasing target. It measures automation density across industries, not your exact workcell demand. A small factory may need more automation than the benchmark suggests. A high-mix workshop may need less.
Start with measurable work. Record cycle time, daily volume, shift length, operator travel, and repeated handling. For example, a 30-second loading task across two shifts may justify a cobot cell. A task requiring frequent product changes may need flexible tooling instead. Check payload, reach, accuracy, and stopping performance under real conditions. The advertised capacity is not always practical after adding grippers and fixtures. This is where many plans become optimistic.
Tips: Convert your workload into robot hours. Compare required hours with available shift time. Leave space for setup, pauses, maintenance, and small mistakes. Test one representative part before scaling. Ask operators what slows the process. Their experience often reveals awkward access, glare, unstable parts, or unsafe lifting that spreadsheets miss. Also review guarding, risk assessment, training, and local requirements with qualified professionals. A benchmark can guide reflection, but it cannot replace a workcell study.
How to Choose the Best Cobot Robot for Your Business? – Assess Workcell Demand with IFR’s 162 Robots per 10,000 Workers Benchmark
Use the workforce benchmark to estimate automation intensity, then match each workcell with its payload, reach, accuracy, cycle-time, and safety requirements.
| Assessment Area | Planning Metric | Reference Value or Range | What the Data Indicates | Selection Implication |
|---|---|---|---|---|
| IFR Workforce Benchmark and Demand Sizing | ||||
| Global robot-density benchmark | Industrial robots per 10,000 manufacturing workers | 162 robots | The International Federation of Robotics reported a global average density of 162 industrial robots per 10,000 manufacturing workers for 2023. | Use 162 robots per 10,000 workers as a high-level reference point, not as a mandatory target for every facility. |
| Estimated automation demand for 100 workers | 100 × 162 ÷ 10,000 | 1.62 robots | A workforce of 100 manufacturing employees corresponds mathematically to approximately 1.6 robots at the benchmark density. | For a small facility, begin with one or two high-utilization workcells and validate the business case before expanding. |
| Estimated automation demand for 500 workers | 500 × 162 ÷ 10,000 | 8.10 robots | A workforce of 500 manufacturing employees corresponds mathematically to approximately eight robots at the benchmark density. | Prioritize repetitive loading, unloading, inspection, assembly, and packaging tasks with stable production volumes. |
| Estimated automation demand for 1,000 workers | 1,000 × 162 ÷ 10,000 | 16.20 robots | A workforce of 1,000 manufacturing employees corresponds mathematically to approximately 16 robots at the benchmark density. | Consider a phased workcell program, standardized tooling, operator training, and centralized maintenance support. |
| Estimated automation demand for 5,000 workers | 5,000 × 162 ÷ 10,000 | 81 robots | A workforce of 5,000 manufacturing employees corresponds mathematically to approximately 81 robots at the benchmark density. | Use portfolio-level planning with common interfaces, repeatable cell designs, digital monitoring, and documented safety validation. |
| Workcell Requirements for Cobot Selection | ||||
| Light assembly and screwdriving | Part handling, fastening, kitting, and component insertion | Payload: 3–7 kg Reach: 500–900 mm Repeatability: ±0.02–0.05 mm |
Best suited to compact workcells with frequent operator interaction and relatively stable part presentation. | Choose a compact cobot with integrated force sensing or a compatible force-control option, plus a flexible end-of-arm tool. |
| Machine tending | Loading and unloading CNC, press, molding, or test equipment | Payload: 5–12 kg Reach: 800–1,300 mm Cycle time: 20–90 seconds |
Demand is driven by machine cycle time, part weight, door access, fixture location, and the number of machines served. | Prioritize reach, payload margin, ingress protection, reliable gripper operation, and recovery after process interruptions. |
| Packaging and case packing | Pick-and-place, carton loading, labeling, and pallet-layer preparation | Payload: 5–16 kg Reach: 900–1,600 mm Cycle time: 4–15 picks/minute |
Higher throughput and larger package sizes increase the need for reach, acceleration, gripper capacity, and coordinated conveyors. | Evaluate the complete cell, including conveyors, sensors, vacuum generation, package variability, and required guarding. |
| Quality inspection | Camera positioning, dimensional checks, surface inspection, and test handling | Payload: 2–7 kg Reach: 500–1,000 mm Positioning: application-dependent |
Inspection performance depends on camera resolution, lighting, fixture repeatability, robot motion, and measurement software. | Select for smooth motion, repeatable positioning, cable management, and compatibility with the inspection system rather than payload alone. |
| Welding and dispensing | Adhesive, sealant, arc-welding, or controlled material application | Payload: 5–12 kg Reach: 900–1,400 mm Path accuracy: process-dependent |
Consistent tool orientation, path quality, material flow, and access to the workpiece are usually more important than maximum speed. | Assess path repeatability, process-tool integration, cable routing, environmental protection, and the need for position feedback. |
| Collaborative operator support | Shared workspace, ergonomic lifting, handoff, and replenishment tasks | Payload: 3–10 kg Reach: 700–1,300 mm Operating pattern: frequent interaction |
Actual collaborative operation depends on speed, tooling, payload, workspace layout, contact hazards, and the completed risk assessment. | Do not assume that a cobot is automatically safe for every application; validate force, speed, separation, safeguarding, and foreseeable misuse. |
| Business-Case Filters | ||||
| Annual operating availability | Planned production hours per year | 1,500–4,000 hours | More available production hours generally improve utilization and shorten the payback period, provided demand is stable. | Compare single-shift, double-shift, and multi-shift scenarios before selecting the number of workcells. |
| Payload margin | Rated payload versus actual tool, part, and dynamic load | Recommended planning margin: 20–30% | Tool weight, gripping force, acceleration, and off-center loads reduce the practical payload available for the workpiece. | Size the cobot using the complete moving load, not the part weight alone. |
| Changeover frequency | Number of product or process changes per shift | Low: 0–2 Medium: 3–10 High: more than 10 |
Frequent changeovers increase the value of intuitive programming, quick tooling changes, recipe management, and adaptable fixturing. | Favor easy redeployment and simple operator interfaces when product mix changes frequently. |
| Deployment readiness | Data, tooling, fixtures, safety, and operator capability | Five readiness checks | A technically suitable cobot can still fail commercially if parts are inconsistent, fixtures are unavailable, or personnel cannot maintain the cell. | Approve deployment only after confirming process stability, tooling, safety validation, training, and maintenance ownership. |
Note: The 162-robots-per-10,000-workers figure is an industry-level industrial-robot-density benchmark reported by the International Federation of Robotics for 2023. It includes industrial robots generally and should not be interpreted as a cobot-only target. Workcell ranges are practical planning guidelines; final selection requires application testing and a documented risk assessment.
Related Posts
-

Why Robotics Automation is the Future of Manufacturing and Workplaces
-
Top 10 Robotics Learning Tools for Beginners to Explore?
-

Top 10 Robotics Lab Innovations Shaping the Future of Technology
-
China Top 10 Robotics Products Suppliers for Global Buyers
-

How to Create a Robot for Your Business in 2026?
-

How to Create Your Own Robot at Home with Simple Materials and Step by Step Guide